
- Admission Open For New batch
Advanced Certification Program in Data Analytics
In Association with:
Certification aligned to:

- Advanced Certification Training Program by Ethan’s.
- 06 Months intensive Data Analytics certification program with hybrid classes (online + offline), ideal for learners aiming to build a strong career in data analytics and business intelligence.
- Suitable for college students, graduates, postgraduates, working professionals, career switchers, candidates with a career gap, and early data professionals.
- Start from scratch – no prior analytics or programming experience required, all analytics fundamentals and prerequisites will be covered step by step.
- Industry-aligned curriculum designed for modern data-driven environments, covering analytics tools, data processing, visualization, automation, and AI-assisted analytics.

31st Dec
Next Batch
06 Months
Course Duration
Hybrid
Online + Offline
5 LPA
Avg Package


Advanced Certification in Data Analytics
Advanced Certification in Data Analytics
Join our Advanced Data Analytics course. This comprehensive program covers essential tools and technologies such as Python, Tableau, Alteryx, Power BI, plotting techniques, Microsoft Excel, SQL, and R programming. Enhance your data analytics skills with expert guidance from Ethan’s faculty. With our course, you’ll gain the expertise to handle real-world business situations using a variety of data analytics tools. Join our Advanced Certification in Data Analytics today and kickstart your journey to becoming a proficient data analyst.
Student workload: 700 Hours | Duration: 06 Months | Training Mode: Classroom & Online
Register to confirm your seat. Limited seats are available.
Guest Lectures by IIT professors
Ethan's Tech Career Track
IIT Approved Mentors
Advance Curriculum
Advanced Data Analytics Training Location
- Wakad
- Kharadi
- Shivajinagar


Learn From the Masters
Our team is made up of industry experts, seasoned professionals, and passionate trainers who work together as a close-knit family. We believe in not just teaching, but inspiring and growing together — creating a learning environment that feels like home and performs like the best in the business.

Gurjeet Sir
Ex IIT Kharagpur, AI

Sachin Sir
Ex Microsoft – Azure

Vinit Sir
Ex IIT Bombay, GenAI

Alam Sir
Cloud & DevOps Architect

Jatin Sir
Ex Credit Suisse, Python

Siddhant Sir
Ex IIIT Allahabad, DSA

Raman Sir
Ex-Data Analyst, MuSigma

Anurag Sir
Ex-IIM Bangalore, GenAI

Himanshu Sir
Unlock 20,000+ Worth of Premium Bonuses 100% FREE!
Master the Best Tech Tools


About the Course
Advanced certification in Data Analytics
What is Data Analytics all about?
Data analytics is the process of examining, transforming, and interpreting data to discover useful information, draw conclusions, and support decision-making. It involves various techniques and tools to clean, process, and analyze data sets, often with the goal of identifying patterns, trends, and relationships that can inform business strategies and operations.
Key aspects of data analytics include:
- Data Collection: Gathering relevant data from various sources, such as databases, spreadsheets, and online platforms.
- Data Cleaning: Ensuring the data is accurate, consistent, and free of errors or duplicates.
- Data Processing: Organizing and structuring the data in a way that makes it suitable for analysis.
- Data Analysis: Applying statistical and computational methods to explore the data, identify patterns, and generate insights.
- Data Visualization: Presenting the analyzed data in visual formats like charts, graphs, and dashboards to make the insights easily understandable.
- Interpretation and Decision-Making: Using the insights gained from the data analysis to make informed decisions and take action.
Data analytics can be applied in various fields, including business, healthcare, finance, marketing, and more, to improve efficiency, enhance customer experiences, and drive innovation.
Which are the different types of Data Analytics?
Data Analytics majorly have 4 verticals, which are
- Descriptive Analytics: It helps the organizations or developers answer the various questions regarding the happenings or the situations
- Diagnostic Analytics: It helps the developers and the organizations to understand why the situation occurred or why it happened.
- Predictive Analytics: It helps organizations understand the trend and predict what will happen in the future.
- Prescriptive Analytics: It helps the organizations know what steps should be taken to the situations and happenings which might occur in the future.
Why choose Ethans Tech for Data Analytics Course?
Hands-on Exposure by the Industrial Experts: Data Analytics course at Ethans Tech is being designed by industry experts from numerous MNCs. After a long series of Brainstorming sessions & considerate discussions, the course has been designed to allow people to get into any IT projects and give a kick start to their career.
Job Assistance Program: Everyone wants to hustle in this generation for a job and the dream work they want. Data Analytics Classes in Pune at Ethan’s help you to get into the IT industry as they have a collaboration with various top-notch organizations that enables our students to get into their domains and the preferred industry. Also, Ethans groom you for the interviews and resume building that gives an edge of competitiveness to the students.
How Ethans provide the training?
The course is designed by industry mentors from various MNCs, after thoughtful discussion and a series of brainstorming sessions. It has been designed to finally enable individuals to comfortably work on any related IT projects. For this, apart from regular sessions, we mentor individuals in terms of building a strong visibility social profile with a good number of use cases and the same application code. We also encourage writing blogs and have self-placed sample projects to build a strong individual portfolio. We mentor in terms of technical discussion and the approach to present oneself better. We do have collaboration with multiple top-notch branches that helps our students in switching their domains and companies. We also arrange a resume building and grooming session for our students, which helps in boosting the credence, and of course, the students are added to our placements forum which helps him/her in getting access to multiple job references from our big pool of faculties and strong network and a technical discussion forum will be maintained in order to sort out your technical queries. Ethans Tech provides you with a course completion certificate post-assessment of the projects assigned, which is a feather in one’s cap.
Syllabus
Advanced certification in Data Analytics
Syllabus for Advanced Certification in Data Analytics at Ethans
Introduction to Computer Programming (Python)
- Programming Foundation Concepts
- Basic Terminology
- Data Types and Variables
- Operators and Expressions
- Control Structures
- Functions and Procedures
- Recursion
- Basic Algorithms
- Object-Oriented Concepts
- Classes and Objects
- Inheritance
- Polymorphism
- Encapsulation
- Abstraction
- Method Overriding
- Constructor and Destructor
- Getting Started with Python
- History of Python
- Python Features
- Python 2 vs Python 3
- Installing Python
- Running Python Scripts
- Python Syntax and Semantics
- Python Development Environments
- Python Installation and Setup
- Python 3.X Installation Guide
- Introduction to Anaconda Python
- IDEs: Jupyter Notebook, PyCharm, and VS Code
- Setting Up Virtual Environments
- Package Management with pip and conda
- Python Built-in Objects
- Numbers (int, float, complex)
- Strings
- Lists
- Tuples
- Sets
- Dictionaries
- Type Conversion
- Control Flow in Python
- Conditional Statements (if, elif, else)
- Looping Statements (for, while)
- Nested Loops
- Loop Control Statements (break, continue, pass)
- Comprehensions (List, Dict, Set)
- Conditional Expressions
- Functions in Python
- User Defined Functions
- Lambda Functions
- Function Arguments (default, keyword, arbitrary)
- Return Statement
- Recursion
- Built-in Functions
- Higher-Order Functions
- String Handling in Python
- String Creation and Operations
- String Methods
- String Formatting
- Regular Expressions
- String Slicing
- Escape Characters
- Unicode Strings
- Data Structures in Python
- List Operations and Methods
- Dictionary Operations and Methods
- Set Operations and Methods
- Tuple Operations and Methods
- Working with Stacks and Queues
- Comprehensions
- Collections Module
- File Handling in Python
- Reading and Writing Files
- File Methods
- File Modes
- Handling Binary Files
- Working with CSV Files
- Context Managers
- File Path Operations
- Python Libraries and Modules
- Standard Library Overview
- Commonly Used Libraries (os, sys, math, datetime)
- Importing Modules
- Creating User Defined Modules
- User Defined Packages
- Working with init.py
- Packaging and Distribution (whl Packaging)
- Advanced Python Concepts
- Object Oriented Python
- Exception Handling
- Debugging Techniques
- Iterators and Generators
- Decorators
- Context Managers
- Metaprogramming
- Database Interface with Python
- Introduction to Databases
- SQLite in Python
- CRUD Operations
- Connecting to Sqlite
- Database Connection Pooling
- Handling Transactions
- Working with Data Formats
- Introduction to JSON Data
- Parsing JSON
- Creating JSON
- Working with XML
- Using CSV Module
- pickle Module for Serialization
- YAML Format
- Web Programming with Python
- Requests Module
- Web Scraping with BeautifulSoup
- Using Scrapy for Advanced Scraping
- Working with APIs
- Numerical Computation with Numpy
- Introduction to Numpy
- Numpy Arrays
- Array Indexing and Slicing
- Array Operations
- Broadcasting
- Numpy Functions
- Working with Matrices
- Data Manipulation with Pandas
- Introduction to Pandas
- Series and DataFrame
- Reading and Writing Data
- Data Cleaning
- Data Transformation
- Merging and Joining
- Data Aggregation
Introduction to RDBMS Database (SQL)
- Introduction of RDBMS
- Definition of RDBMS
- Characteristics of RDBMS
- Advantages of using RDBMS
- Data Models in RDBMS
- Keys in RDBMS (Primary Key, Foreign Key)
- RDBMS vs. NoSQL
- Popular RDBMS Software
- Installing and Using MySQL
- System Requirements for MySQL
- Downloading and Installing MySQL
- Configuring MySQL Server
- MySQL Workbench Overview
- Connecting to MySQL Server
- Basic MySQL Commands
- MySQL User Management
- Querying Single Table
- SELECT Statement Basics
- Filtering Data with WHERE Clause
- Sorting Data with ORDER BY Clause
- Using LIMIT to Restrict Rows
- Aggregation Functions (COUNT, SUM, AVG)
- Grouping Data with GROUP BY
- Handling NULL Values
- Modifying Data and Table Structures
- Inserting Data (INSERT INTO)
- Updating Data (UPDATE)
- Deleting Data (DELETE)
- Modifying Table Structure (ALTER TABLE)
- Dropping Tables and Databases
- Adding and Removing Columns
- Renaming Tables and Columns
- Querying Multiple Tables
- Introduction to Joins
- Inner Join
- Left Join
- Right Join
- Full Outer Join
- Cross Join
- Using Aliases for Table Names
- Constraints of SQL
- Primary Key Constraints
- Foreign Key Constraints
- Unique Constraints
- Not Null Constraints
- Check Constraints
- Default Constraints
- Enforcing Constraints in MySQL
- Importing and Exporting Data
- Importing Data from CSV Files
- Exporting Data to CSV Files
- Using MySQL Workbench for Import/Export
- Using LOAD DATA INFILE
- Using SELECT INTO OUTFILE
- Data Formats for Import/Export
- Handling Errors During Import/Export
- Working With Expressions
- Arithmetic Expressions
- String Expressions
- Date and Time Expressions
- Logical Expressions
- Conditional Expressions (CASE)
- Using Functions in Expressions
- Combining Expressions
- Database Normalization
- Introduction to Normalization
- First Normal Form (1NF)
- Second Normal Form (2NF)
- Third Normal Form (3NF)
- Boyce-Codd Normal Form (BCNF)
- Advantages of Normalization
- Denormalization
- Grouping and Summarizing Data
- Using GROUP BY Clause
- Using HAVING Clause
- Aggregate Functions (SUM, AVG, MAX, MIN)
- Counting Rows with COUNT
- Grouping Sets and Rollup
- Pivoting Data
- Summarizing Data with Subqueries
- Triggers & Cursor
- Introduction to Triggers
- Creating Triggers in MySQL
- BEFORE and AFTER Triggers
- Row-Level and Statement-Level Triggers
- Managing Trigger Execution Order
- Debugging Triggers
- Use Cases for Triggers
- Introduction to Cursors
- Declaring Cursors in MySQL
- Opening and Closing Cursors
- Fetching Data with Cursors
- Cursor Looping
- Handling Exceptions in Cursors
- Use Cases for Cursors
- Functions
- Built-in Functions in MySQL
- String Functions (CONCAT, LENGTH)
- Numeric Functions (ROUND, CEIL)
- Date and Time Functions (NOW, DATE_ADD)
- Aggregate Functions (SUM, AVG)
- Creating User-Defined Functions
- Using Functions in Queries
- Designing and Creating a Database
- Database Design Principles
- Entity-Relationship (ER) Modeling
- Creating ER Diagrams
- Defining Tables and Relationships
- Choosing Data Types
- Setting Up Primary and Foreign Keys
- Implementing Business Rules with Constraints
- Exploring and Processing on Data
- Data Exploration Techniques
- Descriptive Statistics in SQL
- Data Cleaning and Transformation
- Data Integration from Multiple Sources
- Using Subqueries for Data Processing
- Analyzing Data Patterns
- Using SQL for Data Reporting
- Advanced Querying Techniques
- Subqueries and Nested Queries
- Common Table Expressions (CTEs)
- Window Functions
- Recursive Queries
- Dynamic SQL
- Query Optimization Techniques
- Advanced Join Operations
Microsoft Excel
- Introduction to Excel
- Excel Interface Overview
- Navigating the Ribbon
- Understanding Worksheets and Workbooks
- Creating and Saving Workbooks
- Data Entry and Editing
- Customizing the Quick Access Toolbar
- Excel File Formats
- Basics of Excel
- Basic Data Types (Numbers, Text, Dates)
- Basic Excel Operations (Copy, Cut, Paste)
- Autofill and Flash Fill
- Sorting and Filtering Data
- Basic Cell Formatting (Font, Color, Alignment)
- Using the Clipboard
- Adjusting Column Width and Row Height
- Excel Formula
- Basic Arithmetic Formulas (SUM, SUBTRACT, MULTIPLY, DIVIDE)
- AutoSum Function
- Cell References (Relative, Absolute, Mixed)
- Common Statistical Functions (AVERAGE, MEDIAN, MODE)
- Text Formulas (CONCATENATE, LEFT, RIGHT)
- Date Formulas (TODAY, NOW, DATE)
- Logical Formulas (IF, AND, OR)
- Formula Based Formatting
- Conditional Formatting Rules
- Highlighting Cells Based on Values
- Data Bars, Color Scales, and Icon Sets
- Custom Conditional Formatting
- Managing Conditional Formatting Rules
- Using Formulas in Conditional Formatting
- Applying Conditional Formatting to Pivot Tables
- Conditional Statements & Logical Operators
- IF Statements
- Nested IF Statements
- AND, OR Operators
- NOT Operator
- Combining Multiple Conditions
- Using IF with Text, Numbers, and Dates
- Conditional Formatting with Logical Operators
- Text Functions
- CONCATENATE (or CONCAT)
- LEFT, RIGHT, MID
- LEN and TRIM
- UPPER, LOWER, PROPER
- SUBSTITUTE and REPLACE
- FIND and SEARCH
- TEXT Function for Formatting Numbers and Dates
- Date and Time Functions
- TODAY and NOW
- DATE and TIME
- DAY, MONTH, YEAR
- HOUR, MINUTE, SECOND
- DATEDIF
- NETWORKDAYS
- EDATE and EOMONTH
- Excel Tables
- Creating and Formatting Excel Tables
- Table Styles and Options
- Sorting and Filtering Tables
- Adding and Removing Table Rows/Columns
- Structured References
- Table Calculations and Totals
- Converting Table to Range
- Basic and Advanced Table Operations
- Creating Dynamic Tables
- Using Table Formulas
- Advanced Filtering Techniques
- Using Slicers with Tables
- Advanced Sorting Techniques
- Working with Subtotals
- Merging and Splitting Tables
- Data Pivoting with Different Examples
- Creating PivotTables
- PivotTable Fields and Areas
- Grouping Data in PivotTables
- PivotTable Calculations (Sum, Count, Average)
- Creating Pivot Charts
- Filtering PivotTables with Slicers and Timelines
- Advanced PivotTable Techniques (Calculated Fields, Custom Calculations)
- Cell Reference Functions
- Understanding Cell References
- Using Relative References
- Using Absolute References
- Mixed References
- INDIRECT Function
- OFFSET Function
- Linking Cells Between Sheets and Workbooks
- LookUp and VLookUp
- Introduction to LookUp Functions
- VLOOKUP Basics
- HLOOKUP Basics
- Using VLOOKUP with Exact and Approximate Match
- Combining VLOOKUP with Other Functions
- Common VLOOKUP Errors and Fixes
- Alternatives to VLOOKUP (INDEX and MATCH)
- Excel Data Visualization
- Creating Basic Charts (Column, Line, Pie)
- Customizing Chart Elements (Titles, Legends, Labels)
- Using Sparklines for Miniature Charts
- Creating Combo Charts
- Using Conditional Formatting for Data Visualization
- Creating Heat Maps
- Using Data Bars and Color Scales
- Basic Charts in Excel
- Creating Column Charts
- Creating Line Charts
- Creating Pie Charts
- Creating Bar Charts
- Creating Area Charts
- Creating Scatter Plots
- Customizing Chart Types and Styles
- Formatting Charts
- Adding and Formatting Chart Titles
- Customizing Axes (Titles, Scales, Gridlines)
- Formatting Data Series (Colors, Styles)
- Adding Data Labels and Legends
- Applying Chart Styles and Themes
- Using Templates for Charts
- Interactive Charts with Form Controls
- Introduction to Power Query
- What is Power Query?
- Power Query Interface Overview
- Loading Data into Power Query
- Basic Data Transformation (Filter, Sort, Remove Columns)
- Combining Data from Multiple Sources
- Data Profiling in Power Query
- Saving and Loading Data to Excel
- Creating Reports in Excel with Dataset
- Data Preparation and Cleaning
- Using PivotTables for Reports
- Combining Multiple Data Sources
- Adding Visual Elements (Charts, Sparklines)
- Creating Interactive Dashboards
- Automating Report Updates
- Distributing and Sharing Reports
- VBA and Macros
- Introduction to VBA and Macros
- Recording and Running Macros
- Editing Macro Code
- VBA Basics (Variables, Loops, Conditionals)
- Writing Custom Functions
- Automating Tasks with VBA
- Debugging and Error Handling in VBA
- Power Query Editor
- Navigating the Power Query Editor
- Applying Basic Transformations (Replace Values, Remove Duplicates)
- Advanced Transformations (Pivot/Unpivot, Group By)
- Creating Custom Columns
- Merging Queries
- Appending Queries
- Managing Query Steps
Power BI
- Introduction to Power BI
- What is Power BI?
- Power BI Components (Desktop, Service, Mobile)
- Power BI Architecture
- Power BI Use Cases
- Business Intelligence Concepts
- Power BI Licensing Overview
- Installing and Getting Started with Power BI
- Installing Power BI Desktop
- Understanding Power BI Interface
- Power BI Desktop vs Power BI Service
- Connecting to Sample Data
- Creating First Power BI Report
- Data Sources in Power BI
- Connecting to Excel Files
- Connecting to CSV and Text Files
- Connecting to Databases (SQL Server, MySQL)
- Connecting to Web and APIs
- Import vs DirectQuery Mode
- Live Connection
- Power Query in Power BI
- Introduction to Power Query Editor
- Data Cleaning and Transformation
- Removing Duplicates and Null Values
- Splitting and Merging Columns
- Changing Data Types
- Filtering and Sorting Data
- Applying and Managing Query Steps
- Data Modeling
- Understanding Data Models
- Creating Relationships
- Cardinality and Cross Filter Direction
- Star Schema and Snowflake Schema
- Managing Data Tables
- Handling Multiple Fact Tables
- DAX Basics
- Introduction to DAX
- Calculated Columns
- Measures
- DAX Syntax and Operators
- Basic DAX Functions (SUM, COUNT, AVERAGE)
- Using Variables in DAX
- Advanced DAX Functions
- Time Intelligence Functions (YTD, MTD, QTD)
- CALCULATE Function
- FILTER Function
- ALL and ALLEXCEPT
- RELATED and LOOKUPVALUE
- RANKX Function
- Handling Blanks and Errors
- Power BI Visualizations
- Basic Visuals (Table, Matrix, Cards)
- Charts (Bar, Column, Line, Pie)
- Maps and Geographical Visuals
- Custom Visuals from Marketplace
- Formatting Visuals
- Sorting and Filtering Visuals
- Advanced Visualizations
- Drill Down and Drill Through
- Tooltips
- Slicers and Filters
- Bookmarks
- Buttons and Navigation
- Conditional Formatting
- Power BI Reports and Dashboards
- Creating Interactive Reports
- Designing Dashboards
- Combining Multiple Pages
- Applying Themes
- Optimizing Report Performance
- Publishing and Sharing Reports
- Publishing Reports to Power BI Service
- Creating Dashboards in Power BI Service
- Sharing Reports and Dashboards
- Managing Workspaces
- Row Level Security (RLS)
- Power BI Refresh and Automation
- Scheduled Data Refresh
- Using Gateways
- Incremental Refresh
- Monitoring Dataset Refresh
- Handling Refresh Errors
- Power BI Best Practices
- Data Modeling Best Practices
- DAX Performance Optimization
- Report Design Guidelines
- Security Best Practices
- Version Control Concepts
- Power BI Project & Case Studies
- End-to-End Power BI Project
- Business Case Study Implementation
- Real-time Dataset Analysis
- Dashboard Presentation
- Interview-Oriented Project Discussion
Tableau
- Introduction to Tableau
- What is Tableau?
- Tableau Products (Tableau Desktop, Tableau Server, Tableau Online, Tableau Public)
- Tableau Architecture
- Business Intelligence Concepts
- Tableau Use Cases
- Installing and Getting Started with Tableau
- Installing Tableau Desktop
- Understanding Tableau Interface
- Connecting to Sample Data
- Tableau Desktop vs Tableau Server
- Creating First Tableau Worksheet
- Connecting to Data Sources
- Connecting to Excel Files
- Connecting to Text and CSV Files
- Connecting to Databases (SQL Server, MySQL)
- Connecting to Cloud Data Sources
- Live Connection vs Extract
- Data Preparation and Cleaning
- Using Data Interpreter
- Data Types and Data Roles
- Filtering and Sorting Data
- Splitting and Merging Fields
- Handling Null Values
- Pivoting Data
- Data Modeling in Tableau
- Relationships vs Joins
- Types of Joins
- Blending Data from Multiple Sources
- Managing Data Models
- Basic Visualizations
- Creating Tables and Text Tables
- Bar Charts, Line Charts, Area Charts
- Pie Charts and Donut Charts
- Scatter Plots
- Maps and Geographical Visualizations
- Calculated Fields
- Introduction to Calculated Fields
- Basic Calculations
- String Functions
- Date Functions
- Logical Functions
- Numeric Functions
- Level of Detail (LOD) Expressions
- Introduction to LOD Expressions
- FIXED LOD Expressions
- INCLUDE LOD Expressions
- EXCLUDE LOD Expressions
- Use Cases for LOD Expressions
- Advanced Visualizations
- Dual Axis Charts
- Combined Charts
- Tree Maps and Heat Maps
- Bullet Charts
- Waterfall Charts
- Filters and Sorting
- Dimension Filters
- Measure Filters
- Context Filters
- Top N Filters
- Quick Filters
- Dashboards in Tableau
- Creating Dashboards
- Dashboard Layouts and Containers
- Dashboard Actions
- Using Filters and Parameters in Dashboards
- Optimizing Dashboard Performance
- Storytelling with Tableau
- Creating Stories
- Using Story Points
- Designing Effective Data Stories
- Publishing and Sharing
- Publishing Workbooks to Tableau Server
- Publishing to Tableau Online
- Tableau Public
- User Permissions and Security
- Tableau Performance Optimization
- Optimizing Extracts
- Improving Dashboard Performance
- Best Practices for Calculations
- Performance Recording
- Tableau Project & Case Studies
- End-to-End Tableau Project
- Business Case Study Implementation
- Real-world Dashboard Development
- Interview-Oriented Tableau Questions
R Programming
- Introduction to R Programming
- What is R?
- Applications of R in Data Analysis and Data Science
- Features and Advantages of R
- Installing R and RStudio
- Understanding RStudio Interface
- R Basics and Syntax
- R Console and Script Files
- Comments and Help System
- Basic Syntax and Expressions
- Variables and Assignment Operators
- Data Types in R
- Data Structures in R
- Vectors
- Matrices
- Arrays
- Lists
- Data Frames
- Factors
- Operators and Control Statements
- Arithmetic Operators
- Relational and Logical Operators
- If, If-Else Statements
- For Loop
- While Loop
- Repeat Loop
- Break and Next Statements
- Functions in R
- Built-in Functions
- User-Defined Functions
- Function Arguments
- Anonymous Functions
- Apply Family Functions (apply, lapply, sapply)
- Data Input and Output
- Reading Data from CSV, Excel, and Text Files
- Writing Data to Files
- Working with Databases
- Importing Data from External Sources
- Data Manipulation with R
- Data Subsetting and Indexing
- Sorting and Ordering Data
- Merging and Joining Data
- Data Transformation
- Handling Missing Values
- Data Visualization in R
- Introduction to Data Visualization
- Base R Graphics
- Introduction to ggplot2
- Creating Bar Charts, Line Charts, Scatter Plots
- Histograms and Boxplots
- Customizing Plots
- Statistical Analysis Using R
- Descriptive Statistics
- Probability Distributions
- Hypothesis Testing
- Correlation and Covariance
- Regression Analysis
- Data Analysis with dplyr and tidyr
- Introduction to dplyr
- Filter, Select, Arrange
- Mutate and Summarise
- Group By Operations
- Data Tidying with tidyr
- Time Series Analysis
- Introduction to Time Series Data
- Time Series Objects in R
- Trend and Seasonality
- Basic Forecasting Techniques
- Machine Learning Basics with R
- Introduction to Machine Learning
- Supervised vs Unsupervised Learning
- Linear and Logistic Regression
- Classification Techniques
- Clustering Techniques
- Working with R Packages
- Installing and Loading Packages
- Popular R Packages
- Package Documentation
- R Programming Project
- End-to-End Data Analysis Project
- Data Cleaning, Analysis, and Visualization
- Report Generation
- Real-world Case Studies
Features
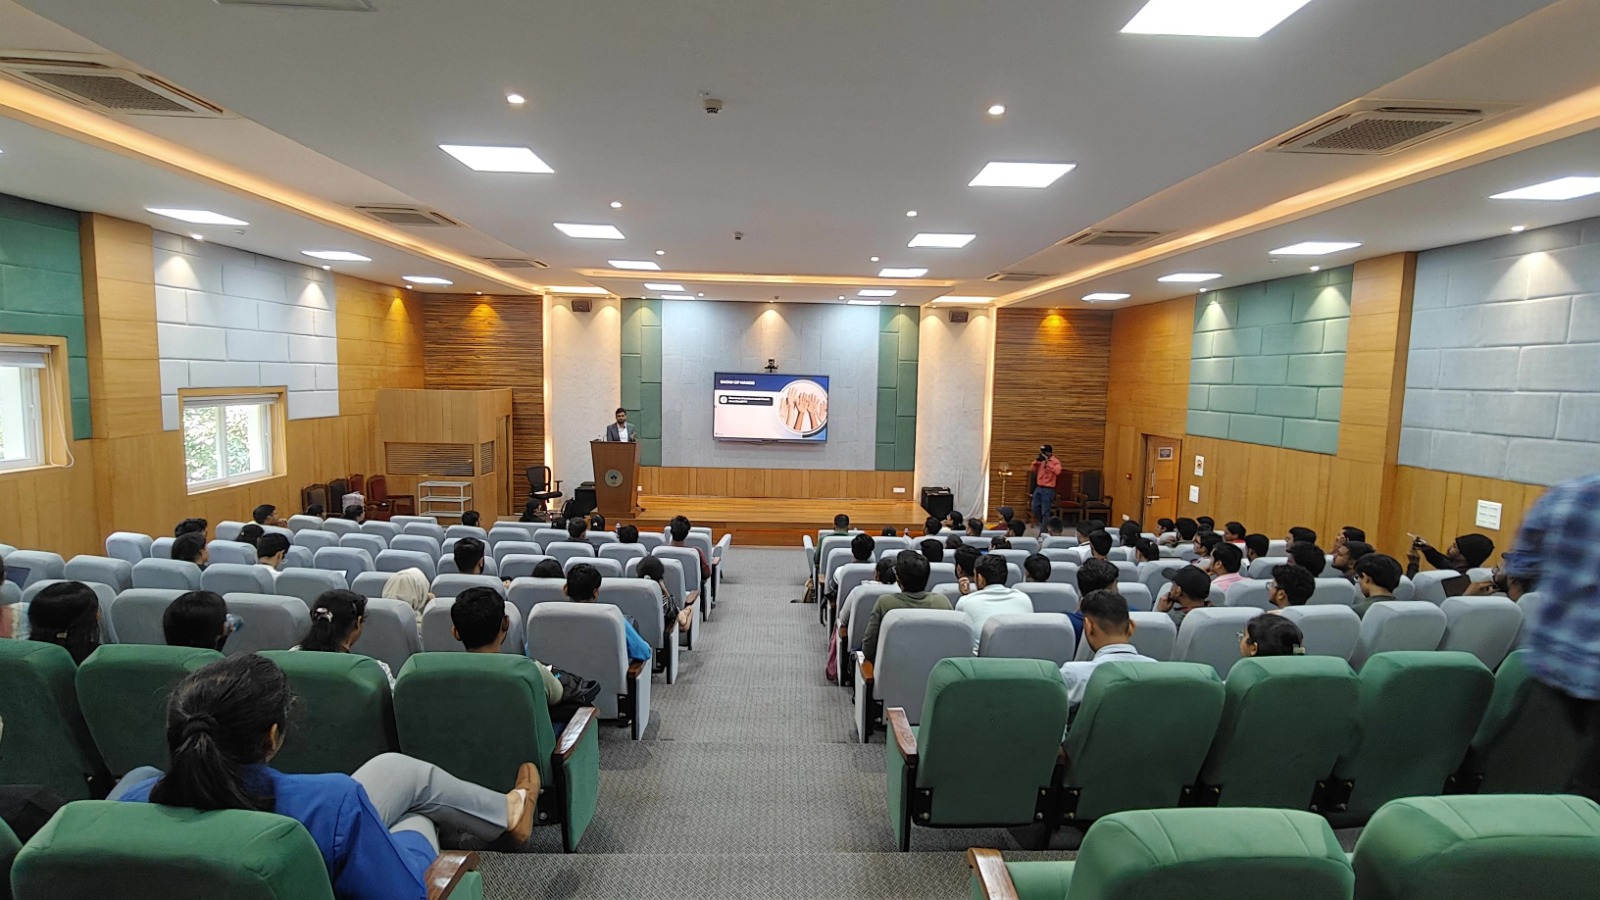
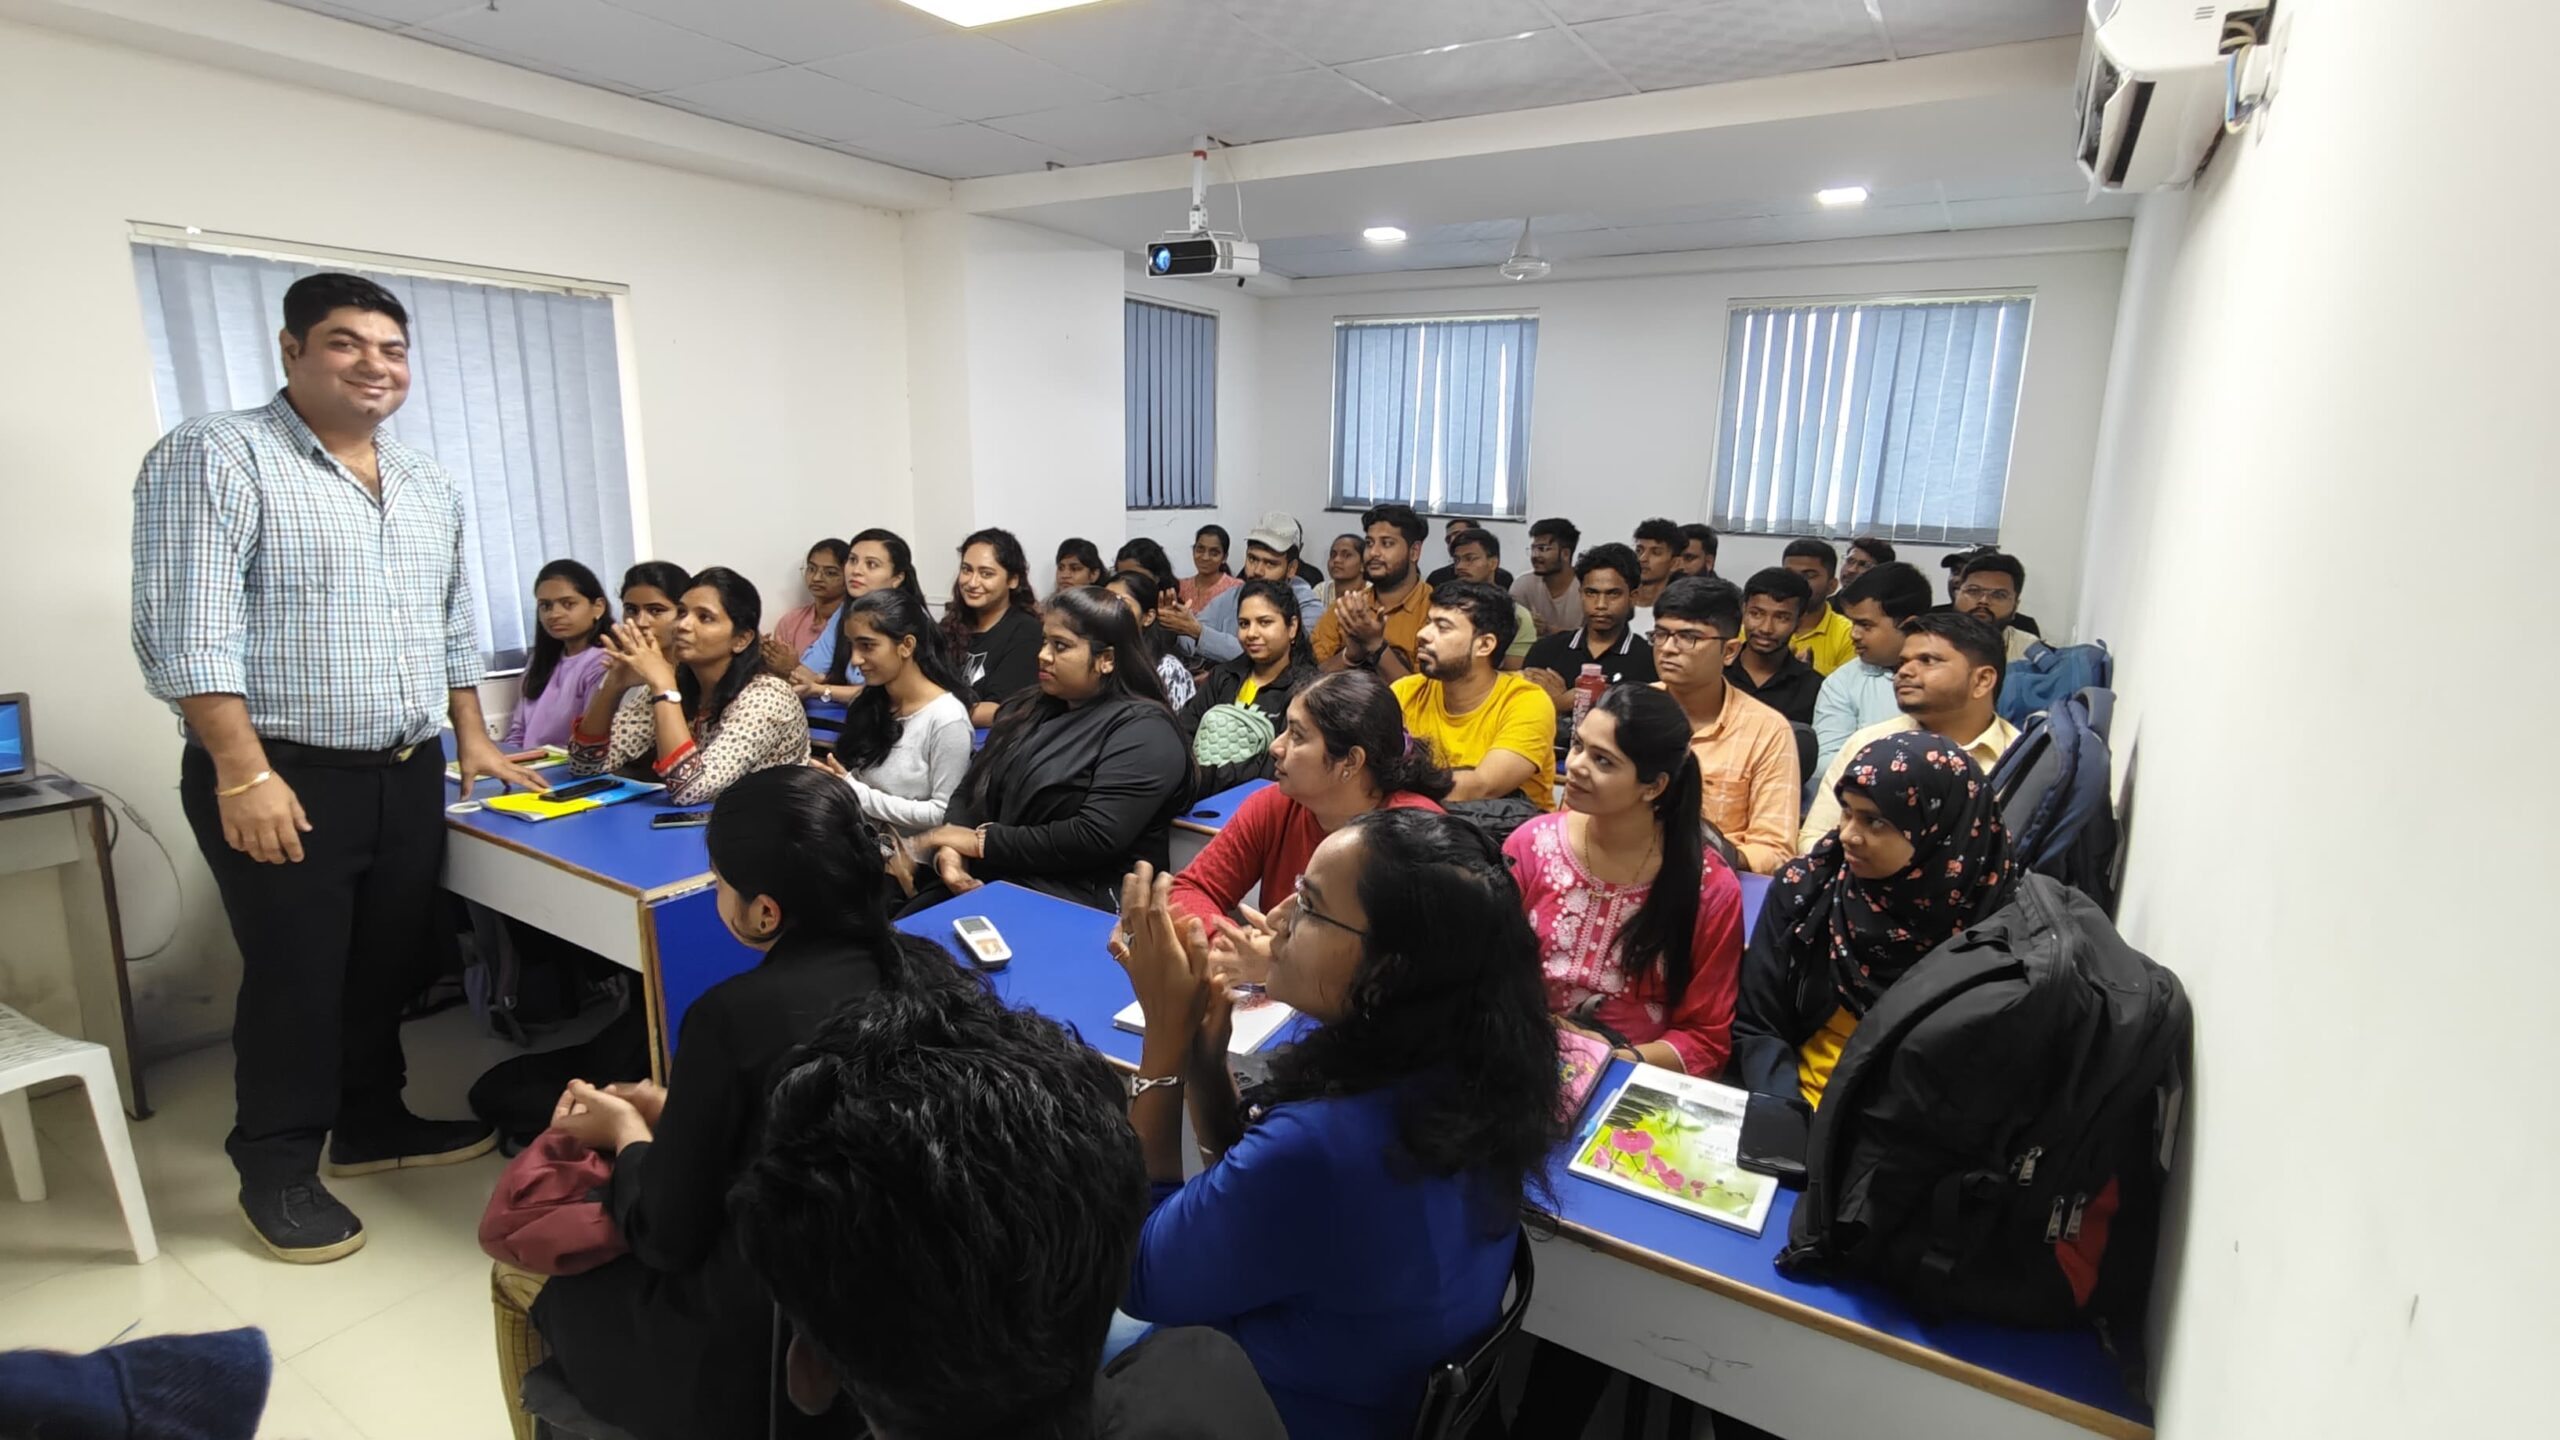
Classroom Sessions
Ethans Pune delivers training designed to meet real-world demands, with strong emphasis on hands-on and project-based learning. Sessions are interactive, ensuring individual attention for every student. Learners also get access to online doubt-clearing sessions, recorded backup classes, and a discussion forum for continuous academic support.
Learning Management System
Our LMS provides free add-on courses to strengthen cross-functional skills required in the industry. Students can revisit recorded sessions from their ongoing batches and access structured study resources. These include assignments, projects, POCs, and reference materials that support learning across all modules and help reinforce key concepts.
Quiz, Assignments & POC's
Each course is supported with topic-wise quizzes, practical assignments, and interview-oriented tasks. Assignments are customized based on student skill level and project needs, typically requiring around one hour daily. These tasks simulate real company scenarios, ensuring hands-on exposure, along with complementary study material for every module.
FutureSkills Prime Certification
Ethans is an ISO 9001:2015 certified institute, offering certifications recognized across industries. After successful assessment by industry experts, students receive a course completion certificate endorsed by FutureSkills Prime. This certification adds credibility to your profile, strengthens your resume, and enhances opportunities upon course and project completion.
Real-life Case Studies
Ethans integrates real-time projects with practical business use cases into its curriculum. Students learn to understand business requirements, perform analysis, and solve implementation challenges. This hands-on approach bridges the gap between theory and practice, helping learners gain confidence by applying concepts to real-world industry scenarios.
Job Assistance Program
After completing a course, eligible students can opt for Ethans’ job assistance program. This includes resume building, profile optimization, and interview guidance. With a strong alumni network of over 5,000 members, job opportunities are regularly shared. Over 3,000 students have successfully placed across leading companies in India.
Learning Management System Here (LMS)
Learn anytime, anywhere & track your progress.
- HD VIDEO
- 24/7 LEARNING
- TRACKER
Industry Projects
Data Analytics Project on Sales & Business Performance
This project focuses on analyzing large sales datasets to uncover trends, revenue patterns, customer behavior, and actionable business insights.
Customer Analytics & Segmentation Project
This project involves studying customer demographics, purchasing behavior, churn patterns, and segmentation techniques to support targeted business strategies.
Financial & Operational Analytics Project
This project analyzes financial and operational data to track costs, optimize processes, forecast performance, and improve decision-making efficiency.
Interactive Data Visualization & Dashboard Project
This project builds dynamic dashboards using modern BI tools to visualize KPIs, performance metrics, trends, and data-driven insights for stakeholders.
Trusted by Leading Platforms

Top-Rated Institute
Featured for Excellence

Top AI Institute

Academic Partner
Data Analytics – Program Highlights
Unlock the power of data analytics with Ethan’s Tech’s Advanced Data Analytics Certification, crafted for aspiring data analysts and business intelligence professionals. This program takes you from absolute basics to advanced analytical techniques, equipping you to work with real-world datasets and reporting workflows.
- 15+ Hands-on Analytics Projects – Gain practical experience by working on real datasets, analytics case studies, and industry-driven use cases.
- Internship-Integrated Data Analytics Program – Apply your analytics skills in real business environments through hands-on internship.
- Comprehensive Coverage – Master Excel, SQL, Python for analytics, statistics, data visualization, Power BI, Tableau, and analytics storytelling.
- Tied-Up with 500+ Companies – Explore job opportunities with leading organizations hiring data analytics professionals.
- 100% Career Support. Access our unique POD hiring platform, career mentorship, and placement assistance.
- Master Data Analysis & Business Insights – Learn to analyze data, build dashboards, derive insights, and present analytics-driven recommendations.
- Job Readiness Program – Includes resume building, mock interviews, and soft skill training to prepare you for tech interviews.
- Recognized Certification – Earn an industry-recognized certification with complete career launch support as a Data Analytics professional.
- Receive industry-recognized certification and 100% placement support, including resume building, mock interviews.
Up-Skill with an Industry-Recognized Certificate
Gain a competitive edge in the job market with our industry-recognized certification, designed to validate your skills and elevate your career.
Validated Certification from Ethans Tech
Receive a professional certificate that validates your expertise and is recognized across leading IT companies.
Training Backed by Real-World Expertise
Ethans Tech follows a practical, hands-on training approach aligned with industry needs, boosting your job readiness.
Professional Credential for Career Growth
Showcase your technical skills with a credible certificate that strengthens your portfolio and improves hiring prospects.
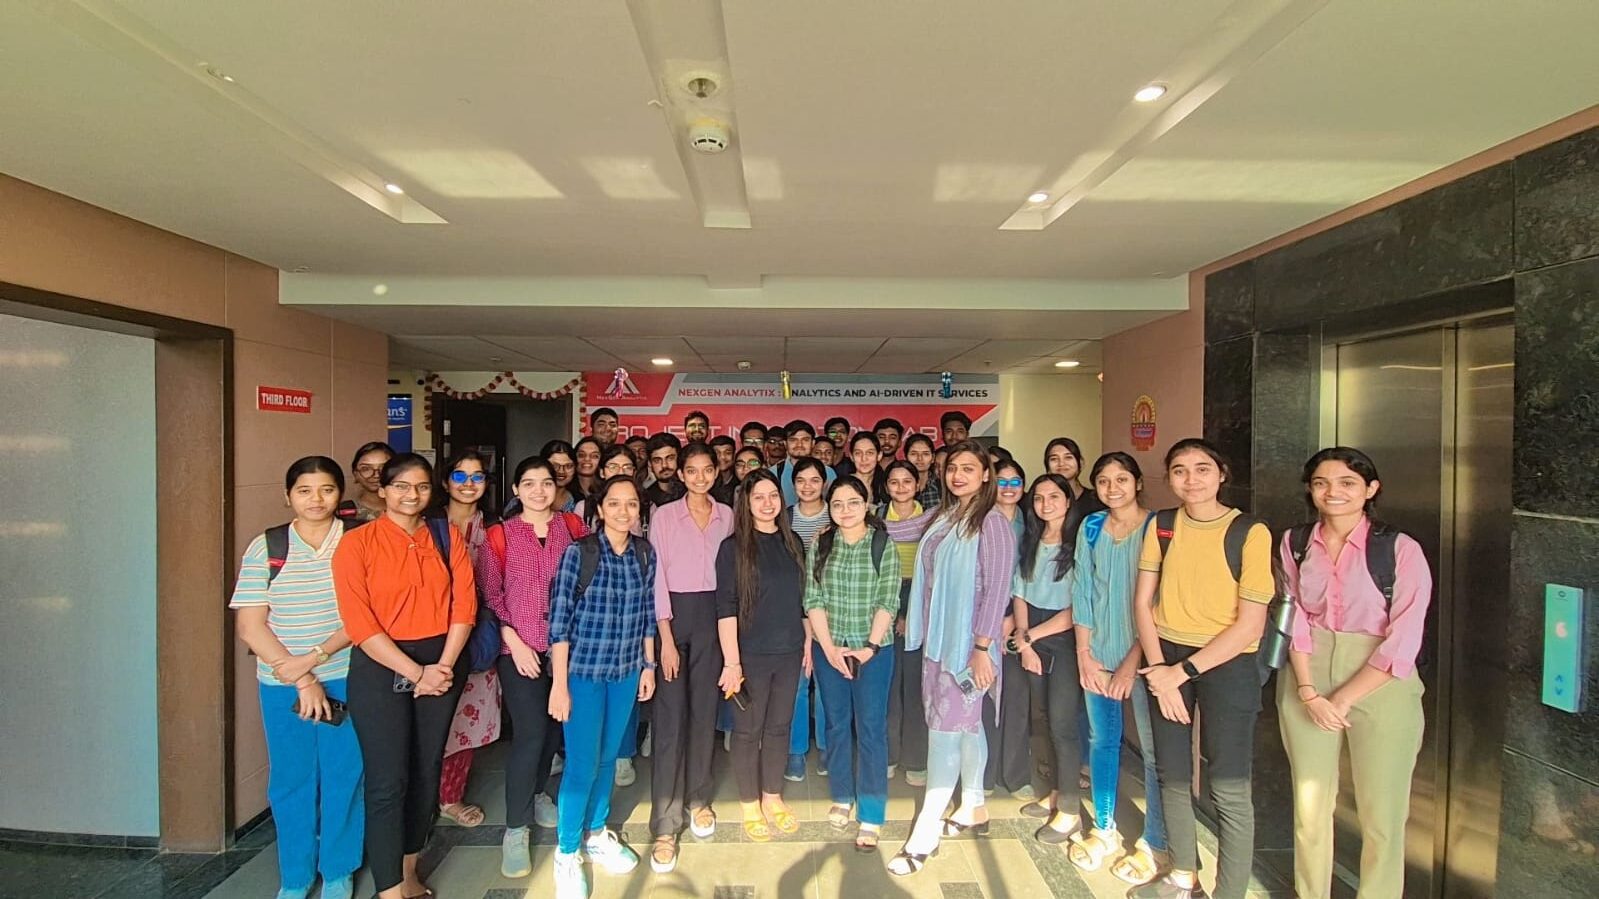
Internship Certificate by Nexgen Analytix
Gain an official internship certificate showcasing your practical experience and real-time project exposure.
Verified Industry Internship Recognition
Highlight your applied skills, teamwork, and domain knowledge through a certificate trusted by employers.
Career-Boosting Professional Doc
Add the internship certificate to your resume and LinkedIn to demonstrate hands-on experience and industry exposure.
Master 12+ In-demand Skills in Data Analytics Course
- Data Analytics Fundamentals
- Data Visualization (Power BI, Tableau)
- Predictive Analytics Basics
- Data Collection & Cleaning
- Descriptive & Inferential Statistics
- Dashboard & Report Creation
- Excel for Data Analysis
- Data Wrangling with Python/pandas
- Business Metrics & KPIs
- SQL & Database Querying
- Exploratory Data Analysis (EDA)
- Analytics Project Deployment
Why to Join this Program
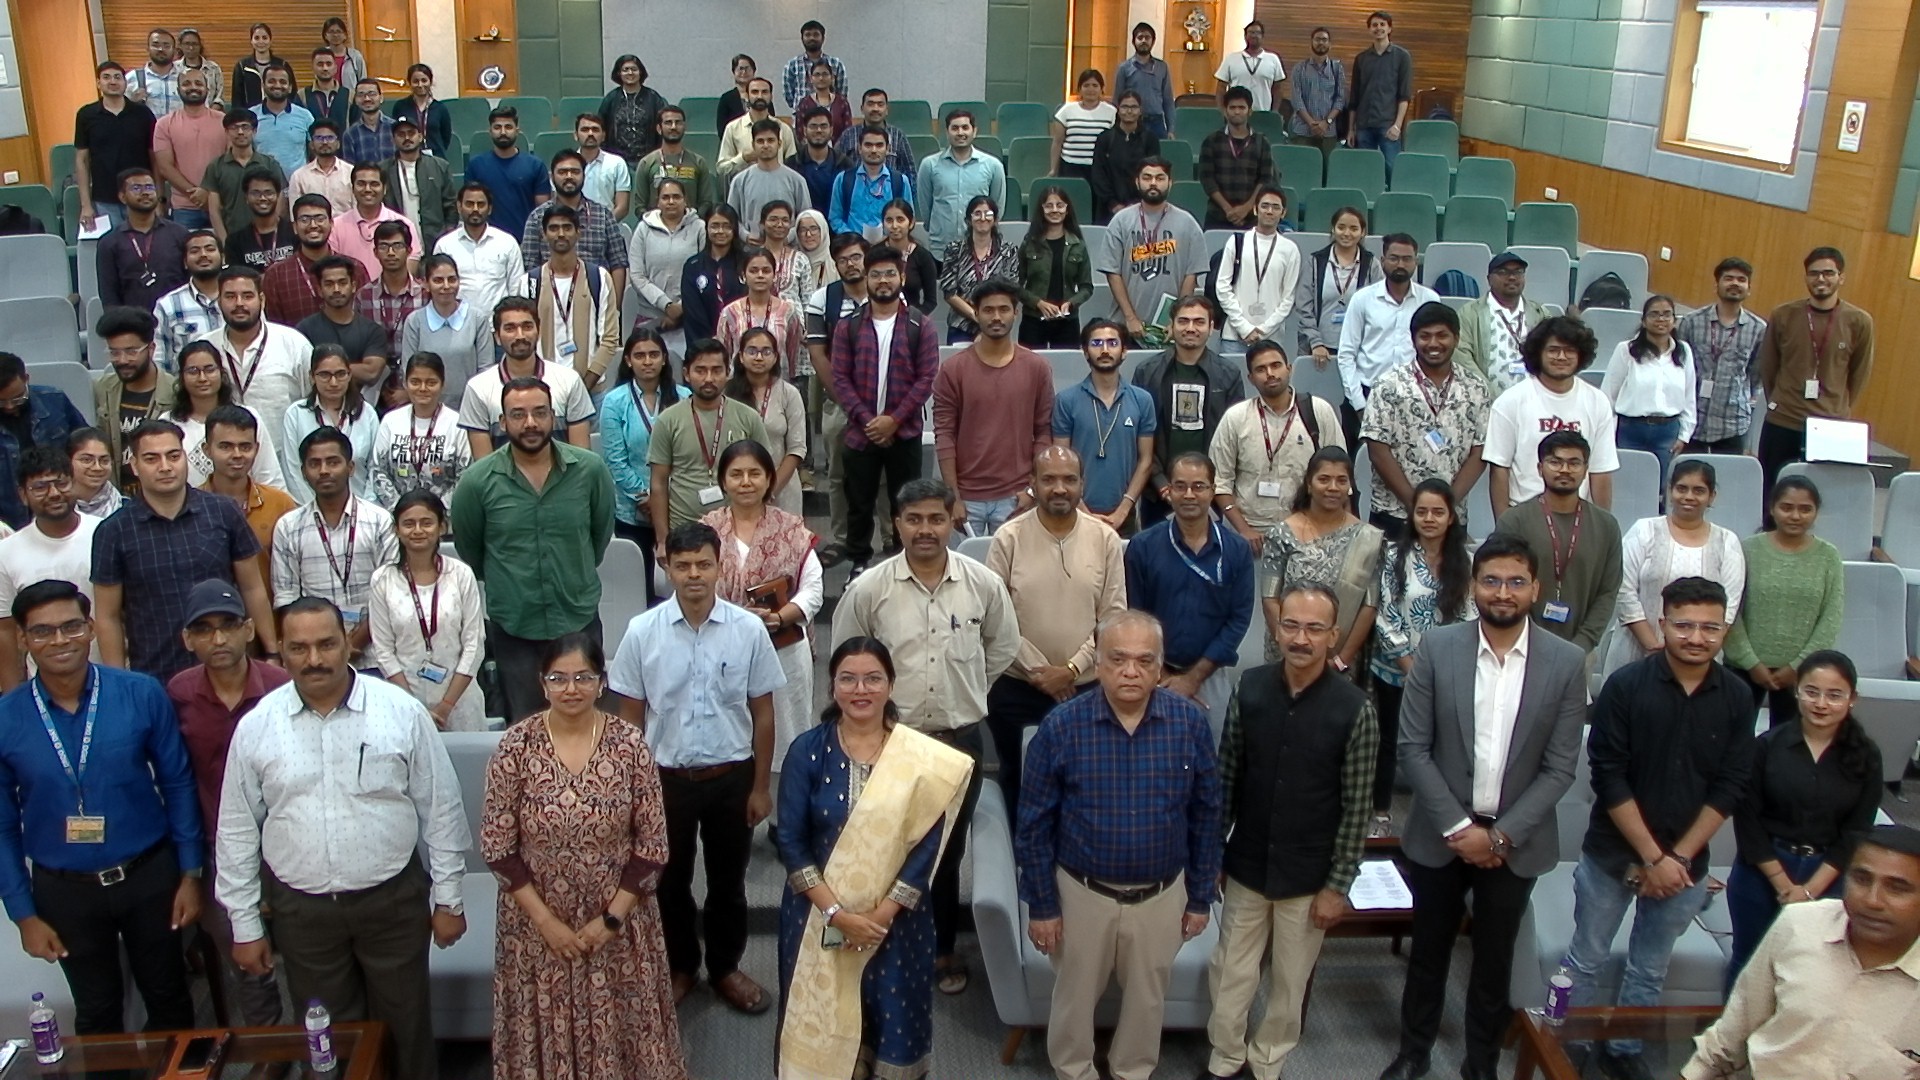
Guest Lectures by IIT professors
Learn directly from top IIT faculty through hands-on, real-time sessions
Ethan’s Tech Career Track
Flexible timelines to complete your course and projects at your own pace
IIT Approved Mentors
Get personalized guidance and career insights from experienced professionals
Advance Curriculum
Master concepts from basic to expert level through structured, applied learning
4.7

4.6
4.5

Next Batch Starts on
31st Dec
Join 1% Elite Cohort
Why Choose Ethan’s Tech?
OTHERS
- Breadth and Depth of Curriculum
- Beginner-Friendly Bootcamp
- GenAI Integration
- Specialised Paths
- Projects Experience
- Alumni & Outcomes
- Hands-On Learning Model
- Mentorship & Faculty Access
- Comprehensive
- Structured Start
- Fully Applied
- Multiple Tracks
- Real-World & Personalized
- Large Network
- Applied & Practical
- Expert-Led
- Limited
- No On-Ramp
- Light Touch
- One Track
- Minimal & Fixed
- Small Base
- Theory-Heavy
- Basic Support
Our Alumni Works Here!


What our Students Say
Ethan’s Tech played a key role in shaping my Python development skills. The course focused on core concepts with real-world applications. Trainers explained topics clearly and provided support. This training helped me gain confidence and secure my role as Python Developer at Automata Pvt. Ltd.


Sarthak Arsul


Cloud Engineer | Minutus Computing
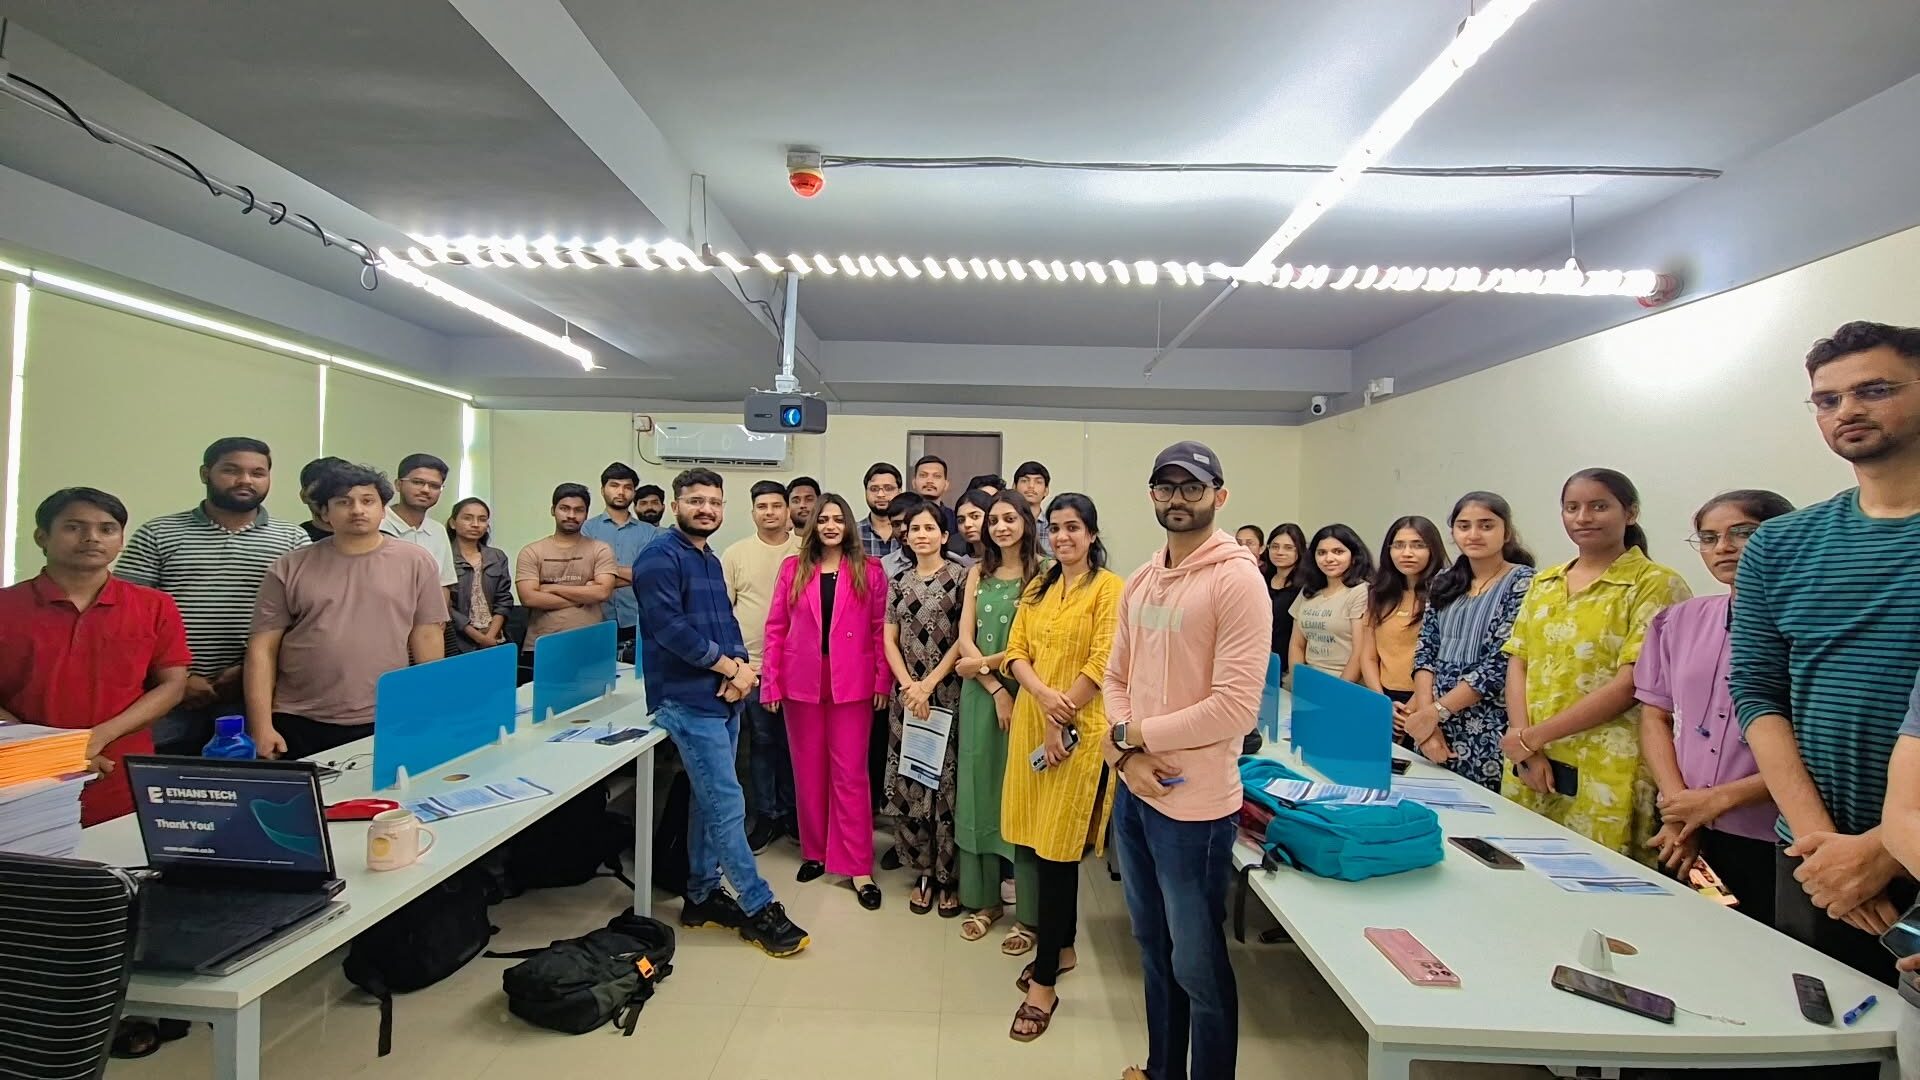
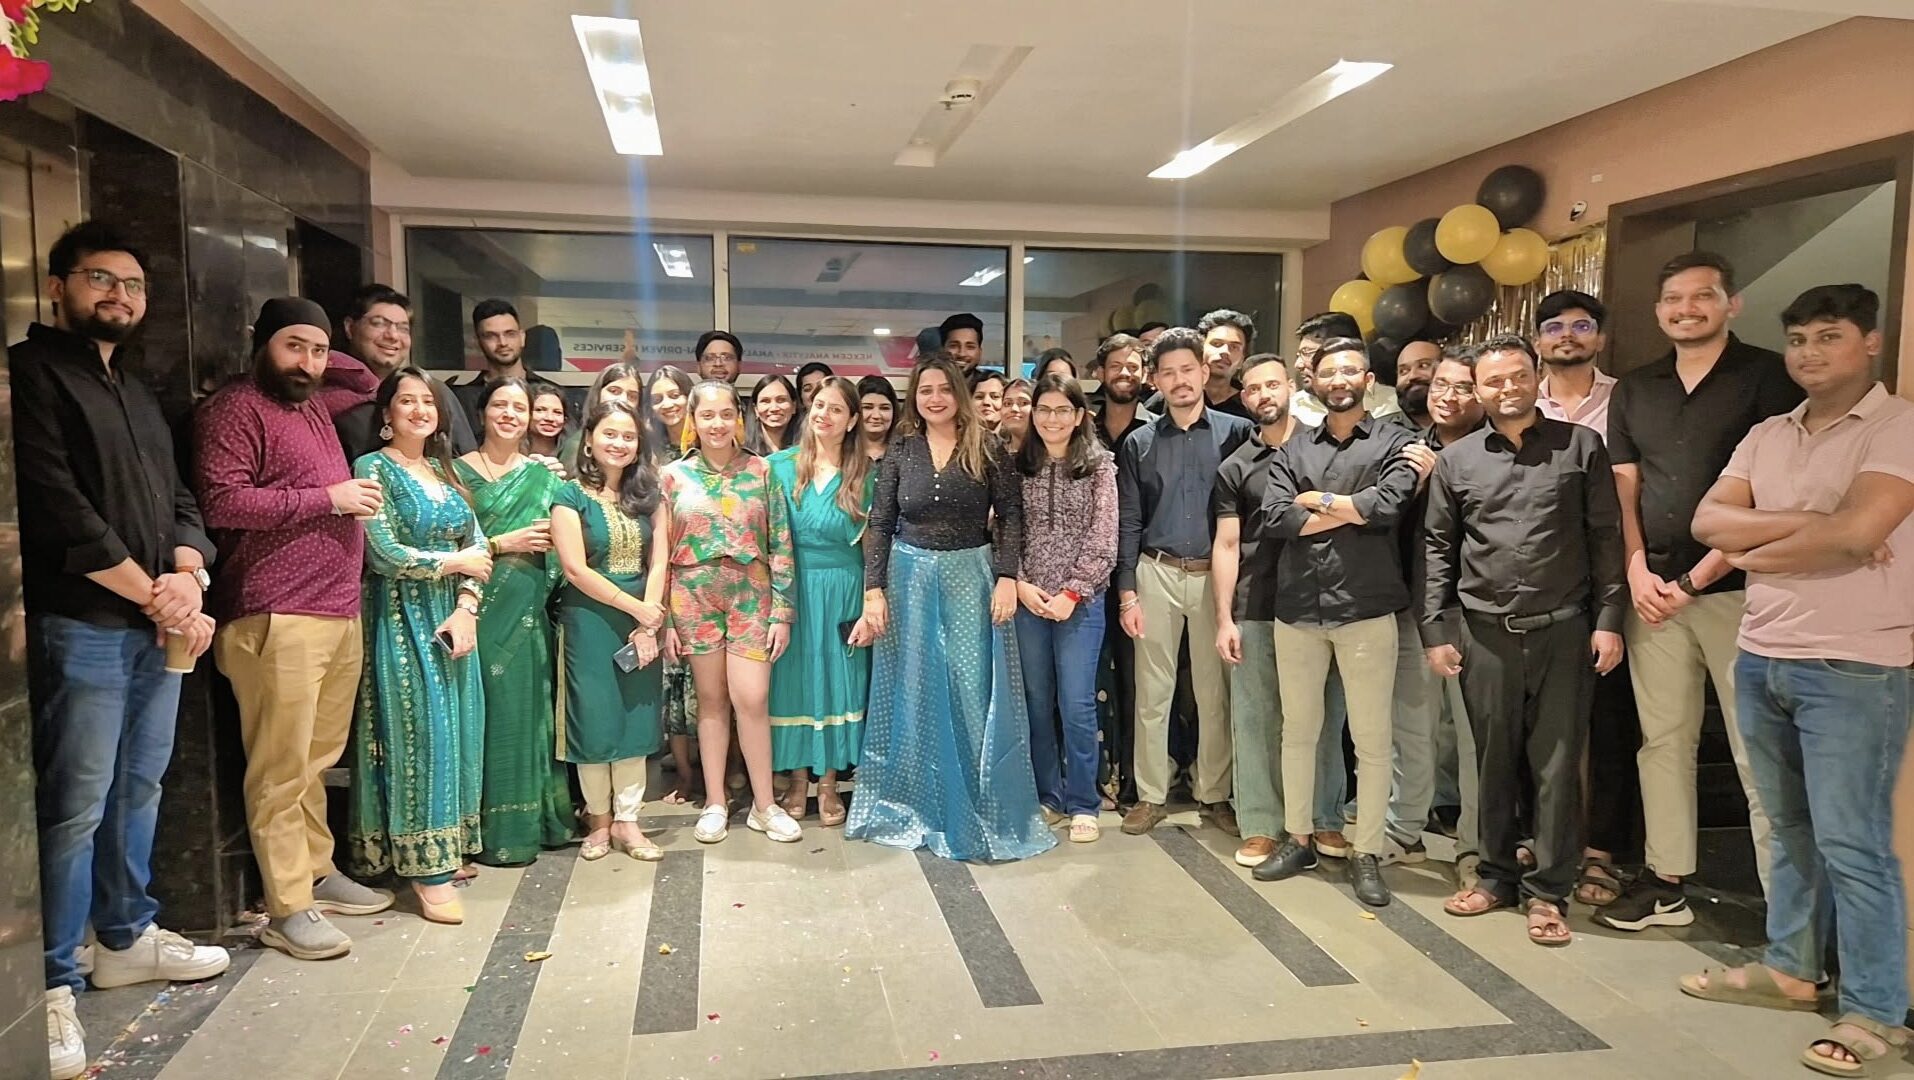
Ethan’s Office Tour
Ethans Tech is a leading professional training institute founded with the mission to bridge the gap between academic learning and real-world skills. With a strong presence in Pune and expanding across India, Ethans Tech has trained thousands of students and working professionals, helping them upgrade their careers in the most in-demand technologies.
The name “Ethans” represents a commitment to “education with excellence”. It’s not just a name; it’s a culture — built by passionate industry experts who believe in practical, hands-on learning rather than rote education. Every trainer at Ethan’s is a seasoned professional with real industry exposure, making the learning experience highly relevant, practical, and impactful.
At Ethans, it’s not just about completing a course — it’s about building a career.
Ethans Tech is a premier professional training institute dedicated to bridging the gap between academic education and real-world industry skills. Headquartered in Pune and expanding across India, Ethans Tech has empowered thousands of students and working professionals to advance their careers in today’s most in-demand technologies. With experienced industry trainers and a strong focus on practical, hands-on learning, the institute ensures highly relevant and career-oriented training that prepares learners to succeed in the professional world.
Get a Free Consultation!
Call us today and get your queries answered by our top experts.
Learners Profile
- 11% – College Graduates (Non-technical backgrounds)
- 23% – B.Tech & M.Tech Graduates (CS, IT, ME, CIVIL)
- 27% – BCA, B.Sc (IT/CS/Maths/Stats) Graduates
- 23% – Early Career Professionals (1–6 years of experience)
- 16% – Career Comeback Learners (with a gap in education or employment)
This blend of learners adds immense value to the learning experience — offering unique perspectives, fresh ideas, and real-world context to every session
Learner Profiles & Trusted Companies
Advanced Certification in Data Analytics FAQs
Everything you need to know about the program.
What are the prerequisites for Data Analytics Training in Pune?
Who should learn Data Analytics Course in Pune?
What if I have queries after I complete this course?
Who are the instructors?
Will Ethans be providing any study materials?
What types of courses are available at Ethans?
Does Ethans provide Job Assistance?
Does Ethans provide weekend classes for professionals?
What are the profiles and experiences of trainers at Ethans?
Do I need to pay the complete fee lump sum or I can have an installment facility too?
The fee which I will pay is refundable or transferable?
What are the facilities and infrastructure at Ethans?
Does Ethans provide Online Training?
Does Ethans provide facility to repeat the batch?
Does Ethans provide Institutional Certification after the course?
Does Ethan's conduct training at Corporates?
Yes, we are frequently engaged in corporate training being the market leader with a big pool of corporate trainers having a wide network with collaboration with several top MNC’S that ultimately becomes an add-on for placing our students with such references.
What is the admission procedure at Ethans?
There are two ways to register with Ethans Tech: online and offline.
Online Registration: Visit the enrollment tab on our website – www.ethans.co.in – which will redirect you to the enrollment form. Fill in your essential details and proceed by paying ₹5,000 as the registration fee (which includes your standard course fees).
Offline Registration: You can contact and visit any of our nearest Ethans branches to complete the registration process with the assistance of our team at the Ethans Desk.